Wealth and Peer Pressure: How Farm-to-School is Leaving Poorer States Behind

usda_map
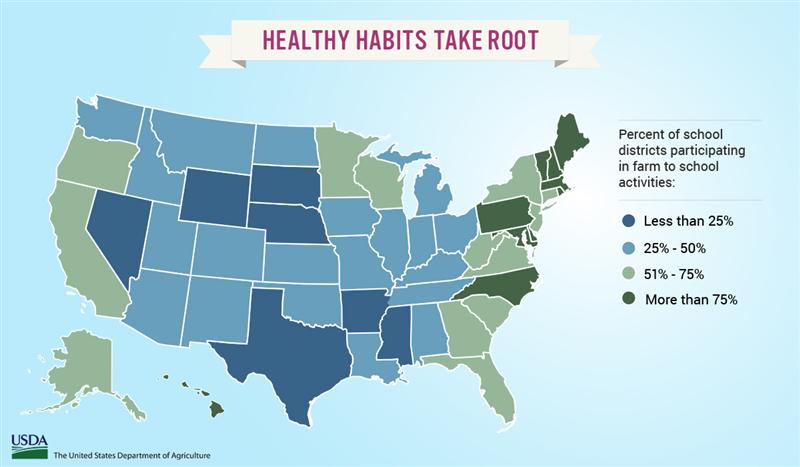
Take a look at the map above. What do you notice?

Although 42% of school districts had farm-to-school programs in 2015, a closer look reveals significant inequalities across states. The number of school districts with farm-to-school programs was 100% in Rhode Island and Hawaii but just 14.9% in Arkansas.

This gap is significant since farm-to-school participation is a good indication of the accessibility of locally sourced, fresh foods in school meals and these programs are known to positively impact both the local economy and the environment.

A new study by Helena Lyson, a researcher at the University of California, Berkeley, seeks to understand what accounts for these disparities. She found that the most important factors were wealth and peer pressure, meaning that these programs are still leaving behind those who could benefit from them the most.

The National School Lunch program has a complicated history. It was initially established to improve nutrition, especially among the poor, and increase domestic consumption of U.S. agricultural products, but these goals have been compromised. Unhealthy, processed, and pre-packaged foods made their way into lunchrooms in the 80’s, when budget cuts led many schools to contract with private food service companies. Schools in lower-income communities were more likely to require these contracts as the budget cuts hit them the hardest. Thus, a program initially established to address in-equality began to exacerbate it, by providing unhealthy food to those who could not afford anything better.

Change seemed to be finally on the horizon in 2010. The Healthy, Hunger-Free Kids Act of 2010 created nutrition standards for all foods sold in schools. It also provided $5 million dollars annually to support competitive grants for farm to school initiatives across the country. Farm-to-school activities include incorporating local foods into school meals, nutrition or agriculture-based activities in classrooms, field trips to farms or farmers markets, and school garden programs. The grant program is highly competitive. In 2013 the USDA awarded funding to only 19% of applicants. The 65 programs established by these grants are estimated to have involved 1.7 million students in 3,200 schools nationwide.

Although the distribution of these grants is supposedly unbiased, the results of the study clearly indicate that the process is favoring wealthier states in the Northeast, where farm to school participation is already high. Vermont received the most funding at $1.02 per student, while Texas received the least at just $0.009 per student. Thirteen states received no funding at all. How are poorer states expected to catch up if all of the funding is going to the rich?

The states with the highest average income per resident, Connecticut and Maryland, are ranked 3rd and 12th in farm to school participation. Meanwhile, the states with the lowest average income per resident, Mississippi and Arkansas, are ranked 47th and 51st. It is not entirely surprising that wealthier states have higher farm to school participation. Wealthier school districts have more money to devote to these programs, their teachers can devote time to activities outside the required curriculum, and they might even have someone to help with the grant writing process.

sare-map_color

The fact that peer pressure is a predictor of farm to school participation is somewhat unexpected. Peer pressure in this context means that states mimicked the behavior of their neighbors. States in regions with high farm-to-school participation were more likely to also have high participation. The regions in this case refer to those designated by the Sustainable Agriculture Research & Education (SARE) program, shown on the map above. However, the power of peer pressure varied from region to region; states in the North Central region had the widest range of farm to school participation, while the participation of states in the Northeast was similar to that of their neighbors. This difference may be due to the fact that states in the Northeast are smaller and the population is more concentrated than in the North Central region.

By allowing wealth and peer pressure to drive growth in farm-to-school programs, the grant-based system is reinforcing existing inequalities. Under this framework, the South, a poor region of the country where the few farm to school programs exist, and where children already have the highest obesity rates in the country, is at a particular disadvantage.

To create a more just food system, poorer states need better access to farm-to-school grants. Considering the regional peer pressure effect shown in the study, increasing the farm-to-school rate in even one state in a region without many farm-to-school programs could encourage other states to follow their lead. Therefore, lower income states and school districts should be given priority to receive more funding. Furthermore, efforts should be made to help them with the grant writing process and implementation of farm-to-school programs. Farm-to-school will not be the solution it promises to be if it continues leaving the poorer half of the country behind.


A real life villain with the power of invisibility? Microplastics.


The boat rocks lightly. A fisherman stares down at his net in the water patiently. When he pulls it up, the catch could be described as meager, at best. One would expect overfishing to be the culprit of lower fish catches these days. Or maybe climate change. But, there is one threat lurking beneath the water’s surface that could be causing some serious issues for fish and fishermen—microplastics.

A recent study conducted by Oona M. Lonnstedt and Peter Eklov at Uppsala University in Sweden shows just how much of a threat microplastics can be. Lonnstedt and Eklov studied Eurasian perch larvae, a freshwater perch native to Europe and northern Asia, which is fished for food and game.


Example of Eurasian perch larvae used in study.

Example of Eurasian perch larvae used in study.


The researchers found that microplastics are making fish stupider and lazier. Microplastics inhibited the fish larvae’s abilities to avoid and detect predators. They also reduced their activity levels, how many hatched from their eggs, and their body size.

Microplastics are pieces of plastic less than 5mm in length, which is a little less than the width of a wooden pencil. Plastic is not biodegradable, so over time it breaks down into smaller and smaller pieces called microplastics.

Scientists suspect these pieces of plastic will last hundreds to thousands of years or more in the environment. That potato chip bag that blew out of my hand on a whale watching boat ten years ago? It’s still in the water, but not so visible to us anymore.

Lonnstedt and Eklov’s research comes at a time when microplastics are raising international concern for their potential health effects in marine organisms and humans. In February, another study revealed that microplastics impair oyster reproduction. Other studies are finding that microplastics are showing up in much of our seafood and even sea salts. There is concern among scientists that if we ingest enough microplastics we may experience health effects similar to those shown happening in marine creatures, like infertility.

Almost half of the human population depends on fish for protein or on fishing for their livelihoods. In 2013, 3.1 billion people depended on fish as a primary source of animal protein. 12% of the world’s population depends on fisheries for their income. More than 90% of these people are small scale fishers.

According to Lonstedt and Eklov’s research, the fish populations people depend on could be in serious jeopardy if microplastic concentrations continue to increase.

For their study, Lonnstedt and Eklov reared Eurasian perch larvae in aquariums with three different microplastic concentrations: no microplastic particles, a current environmentally realistic concentration of microplastics, or a high concentration of microplastics. The larvae placed in high microplastic concentrations were less healthy and more likely to be killed by predators.

Eurasian fish larvae from study that has filled its belly with microplastics, the small clear dots.

Eurasian fish larvae from study that has filled its belly with microplastics, the small clear dots.


When placed in a simulated natural environment with juvenile pike fish, a natural predator to young perch, all of the perch fish larvae that grew in high concentrations of microplastics were killed after 24 hours, compared to two-thirds of perch reared in an average microplastic concentration. Those reared in water with no microplastics did the best: only one half of the fish died.

Most surprisingly, Perch reared in the highest level of microplastics seemed to actually prefer eating plastic particles rather than their natural food. Plastic is not nutritional so, not surprisingly, these young fish were significantly smaller and weighed significantly less.

Though more research needs to be completed, this study indicates that microplastics could have wide-ranging effects on fish populations and, consequently, entire food webs if other fish larvae react similarly to microplastics.

This is bad news for fish and people. Many communities depend on fish as a means to survive and for their livelihood. If fish actually prefer eating plastic over their natural food sources, that means when we eat seafood, we will be consuming more microplastics too.

We create and throw away more plastic everyday. This study highlights the need for better management of plastic waste and the importance of further research on microplastics, an unseen, but all too real threat for fish, fisheries, and ourselves.


Is Uber Building The Next Subway?: How Ride-Sharing is Transforming Urban Transport

Once every half-century or so, there is a technology that transforms transportation in America — the railroad, the automobile, or the jet plane. Some point to self-driving and electric-powered vehicles as the next breakthrough. But a 2014 study suggests that the revolution may not be new technology, but advances in how we use it.

Researchers at MIT analyzed over 150 million taxi trips in Manhattan in 2011 and found that if New Yorkers had been willing to wait five minutes more, almost all of those trips could have been shared with at least one other person. Despite the initial delay, by filling those empty seats, thousands of taxis can be taken off the road, reducing overall travel times by up to a third. Therefore, as inconvenient as this extra five-minute wait may seem at first, it will be worth it in the end to customers that need to get across the city quickly.

This would be good for taxi drivers too. They would be able to drive more or less continuously, no longer idling their engines between customers, resulting in a more predictable and stable income and saving fuel as well.

This is not a new concept. Carpooling originated during WWII to conserve rubber, and it resurfaced in the 1970’s oil crisis. Four decades later, however, the combination of white flight to the suburbs, lower gas prices, and cheaper cars have taken their toll. The 2010 census revealed that only one in ten people carpool to work, compared to one in four in the 1970’s.


Carpooling propaganda in the 1940's.

Carpooling propaganda in the 1940’s. (Image credit: Wikipedia.)


But times are changing. Millennials are reversing the suburban trend and abandoning the ideal of car ownership. The emergence of a “sharing economy” after the Great Recession of 2008 has fundamentally changed our view on privacy and ownership. Nowadays we open up everything from our cars on Uber and Lyft to our homes on Airbnb to complete strangers. For some, this type of collaborative consumption is borne out of economic necessity. For others, access to the Internet and smartphones has broken down the psychological barriers that normally restricted the practice of sharing to family members, friends, and tight-knit communities.

Although data shows that ride-share services actually increased traffic in New York City by 8%, both Uber and Lyft rolled out new programs in 2014 that may change that. The MIT study concluded that an increase in shared trips significantly shortens travel times. Called UberPOOL and Lyft Line respectively, these programs now make up over half of all Uber trips and 30% of all Lyft trips. According to Uber’s internal assessment, in the first three months of 2016, UberPOOL avoided about 21 million miles of driving and about 3,800 metric tons of carbon dioxide emissions.

But, objectively, just how environmentally friendly are services like UberPOOL and Lyft Line? We may have the answer soon enough. The Transportation Sustainability Research Center at the University of California, Berkeley partnered with the National Resources Defense Council in 2015 to study the climate impact of these new transportation-network companies (TNCs). The results of their analysis are due out this fall.

In the meantime, it is safe to assume that there are competing forces at play. In New York City, with the highest share of carless households in the U.S., ride-share services such as Uber and Lyft might be luring customers from greener modes of transportation such as walking and biking, as well as taking employment opportunities away from more traditional and regulated industries such as taxi driving.


Protest against Uber by the Transportation Fairness Alliance in Portland, Oregon in January 2015. (Image credit: Wikipedia.)

Protest against Uber by the Transportation Fairness Alliance in Portland, Oregon in January 2015. (Image credit: Wikipedia.)


Or, conversely, they might be an important complement to light rail and buses, influencing decreasing demand for individually owned vehicles, all while reducing air pollution and congestion. “What fascinates me about these things is: can they move us closer toward a vision of an integrated public transit system?” asks Dr. Susan Shaheen, who is heading up the UC Berkeley study.

So if you, like me, are a car-less 18 to 34-year-old who has taken UberPOOL, then congratulations: you have helped to shape the future of urban transportation in America. Whether that change is for better or for worse, only time will tell.

Nor’easters bring rain, snow, and (surprise) energy!

Windmills in a row on cloudy weather, wide shot, denmark

Offshore wind turbines in Denmark

If renewable energy sources are going to power the 21st century, what will we do when the wind doesn’t blow or when the sun doesn’t shine? The proposed solution is usually energy storage. But research from Stanford University shows that offshore wind production and electricity demand match more closely than anticipated. Most exciting, the study concludes that Massachusetts is the best location on the East Coast for offshore wind turbines.

Massachusetts has ambitious goals for renewable energy. The state made a historic commitment to offshore wind in its 2016 energy bill, which promises to bring clean energy and jobs to Massachusetts. But after the Cape Wind Project’s recent abandonment, it is still not clear that the future of wind in Massachusetts is a sure thing.

One of the most pressing challenges for renewable energy is the mismatch between energy production and electricity demand. Because there is virtually no storage for electricity, this is a challenge for scaling up renewable energy. Surprising and exciting, the Stanford study found that the peak electricity demand matched the peak offshore wind energy production for almost all seasons in Massachusetts.

Usually peak demand for electricity occurs in the late afternoon when people get home from work, turn on their lights and begin to cook dinner. Right now fossil fuel power plants ramp up to meet that demand. But offshore wind production matches the increased demand, the Stanford study found. It modeled offshore wind production and compared it to East Coast electricity usage. This counters energy experts who have assumed only fossil fuels can meet peak demand.

The study also reveals that the most challenging season for offshore wind nationwide is summertime. There is less wind when demand peaks, when electricity is needed to power air conditioners in the summer heat. This is less of a concern for Massachusetts because wind remains pretty high and the state has less cooling demand than the more southern states.

Why is offshore wind right for Massachusetts? The best states for offshore wind have two key characteristics: densely populated and coastal. This is because wind energy can serve a large population with less investment in transmission infrastructure. Massachusetts definitely has these characteristics. The study also found that Massachusetts has the best wind resource on the East Coast with its frequent and high-speed winds, averaging 19mph.

Bostonians dread nor’easters, but these storms hit the sweet spot for offshore wind generation. Unlike hurricanes, the wind speeds are not too much for offshore wind turbines. Rather, their prevalence is why Massachusetts has the best wind resource. Our nor’easters come in handy when generating wind energy.

Installing turbines on an ocean shelf has important advantages: turbines can easily be installed due to shallow waters further offshore which also that have stronger winds to generate more energy. So the extended shallow ocean bank, called George Banks, off the coast of Cape Cod is ideal for siting wind turbines. The Stanford model agrees.

Massachusetts has the potential to be the West Virginia of wind energy. The Stanford study considered factors like ocean depths, wind availability, and the risk of hurricanes when they modeled the potential for offshore wind energy on the East Coast. Massachusetts meets all of these requirements.

How effective wind energy will be depends on future technological advances. The Stanford study predicts that existing technology would meet about a third of East Coast electricity demand. But if advanced technologies, like floating turbines, are commercialized, the study predicts offshore wind could meet nearly all of East Coast energy demands. Since the East Coast depends on coal and natural gas for electricity generation, this would be great progress in diversifying and greening up the energy grid. Nationwide, fossil fuels generate over 60% of electricity while wind generates only 5%. With future technologies, offshore wind has the potential to change these percentages drastically.

Offshore wind alone cannot meet all energy needs. Rather, a diverse clean energy portfolio is needed to provide clean energy and jobs and combat climate change. And this diverse clean energy portfolio for Massachusetts starts now, just offshore.


“Ha-Tuna Matata”: How Tuna Could Relieve our Energy Worries

Responsible for a whopping 39 percent of US carbon emissions, buildings are silent contributors to climate change.

Surprisingly, researchers think the solution to these emissions lies in the ocean.

A new study funded by the Ministry of Economy and Competitiveness of the Spanish Government found that the tuna’s metabolism could serve as a model for how the layout of modern buildings can disperse human body heat in more efficient ways, decreasing fossil fuel use. The “tuna model” is an example of biomimicry, the design of systems and materials based on examples found in nature.

Conducted by researchers and architects as part of the Redesign of the Integration of Building Energy from Metabolisms of Animals (RIMA), the study modeled the annual heat generation, heat loss, and total energy use of two different floor plans within the same building—the Gamesa Headquarters in Pamplona, Spain – in three different climates. Simulations found that the rearrangement of office building floor plans in favor of the tuna model can save 16-39% of building’s annual energy demand. That’s huge.

Why does the tuna model reduce energy demand? Some species of tuna can regulate their interior temperature so efficiently that their bodies can be warmer than the water around them — often by 10 degrees Celsius. It is unusual for fish to be so warm because their heat usually escapes through the gills before the rest of the body can be warmed.

The anatomy of a tuna. The dark muscle encircles the spine. Credit: http://www.fao.org/fishery/topic/16082/en

The anatomy of a tuna. The dark muscle encircles the spine.
Credit: http://www.fao.org/fishery/topic/16082/en

However, a tuna avoids this heat loss through a process know as “countercurrent heat exchange”. The tuna’s heat is generated within dark muscle, a long strip of red muscle that runs along both sides of the spinal column.

This muscle has a complex vascular system where blood flows in arteries and veins that are in close proximity and are parallel to each other. The heat generated by the muscle warms the blood, and its excess heat is transferred to the cooler blood returning to the muscle before the warmer blood reaches the gills. Thus, this process allows heat to be efficiently transferred and retained within the tuna’s body rather than be lost to the exterior environment.

Illustration of countercurrent heat exchange process. Credit: http://0-link.springer.com.luna.wellesley.edu/article/10.1007%2Fs12273-016-0273-8#enumeration

Illustration of countercurrent heat exchange process.
Credit: RIMA study

How can this help us design more efficient buildings? In the study, enclosed spaces like offices or meeting rooms functioned as a building’s “dark muscle”; the more people that are in a room, the more heat is generated. That heat, especially when combined with heat given off by lighting fixtures and building machinery, can add up. Tapping into the natural heat generation of the human body decreases the building’s demand for external heat (often generated by fossil fuels) and the building’s total energy footprint.

What the tuna teaches us is that the key to maximizing body heat retention in buildings lies with the placement of these enclosed spaces.

In most office buildings, private offices and meeting rooms are located along the perimeter of a floor, near the windows. This layout, while desirable for its office views, is energetically problematic because the valuable body heat generated within them is likely to escape through the window before it can heat other areas of the floor – just like heat escapes through a fish’s gills.

The two floor plans modeled in the simulation. The tuna model (a) features closed office spaces placed together in the central ring, and the average office layout (b) features decentralized office spaces. Credit: http://0-link.springer.com.luna.wellesley.edu/article/10.1007%2Fs12273-016-0273-8#enumeration

The two floor plans modeled in the simulation. The tuna model (a) features closed office spaces placed together in the central ring, and the average office layout (b) features decentralized office spaces.
Credit: RIMA study

In the tuna model, however, the office spaces and meeting rooms are placed in a centralized ring around the interior core of elevators, just like tuna’s muscle wraps around its spine. Placing the offices in close proximity to each encourages a countercurrent heat exchange to take place. As expected, the tuna model resulted in more efficient use of the building’s internal heat, while the decentralized office layout exhibited greater demand for heat and total energy.

Using the metabolism of the tuna as a model for the energy systems of buildings has major implications for the way humans think about and interact with their built environment. While sustainable construction materials like living concrete and biomimetic building exteriors are important steps down the path towards a greener and cleaner city, they do not incorporate human services into the equation. With the tuna as our guide, perhaps we can swim against the tide of climate change and design cityscapes with both humans and nature in mind.

The Untold Story of the Clean Air Act

An image of mountain top removal in Appalachia. Photo by Mario Tama

Environmentalists have described the Clean Air Act as a “genuine American success story.” No other law has done more to generally improve human health than the amendments passed in 1990, which limited harmful pollutants that can cause heart disease, bronchitis, asthma and other respiratory sicknesses. While these widespread public health improvements are clear, in Appalachia the Clean Air Act has a mixed legacy. Surprisingly, some Appalachian communities are dying at an earlier age due to unforeseen consequences of the 1990 amendments. The Clean Air Act is benefiting the many at the expense of the few.

A recent study brings this untold story of the Clean Air Act to light. It shows that mortality rates are increasing in coal-mining communities in Kentucky, Tennessee, Virginia and West Virginia. All of these states saw an increase in mountain top removal coal mining after the introduction of the 1990 amendments, which promoted the use of clean low-sulfur coal to curb acid rain. Sulfur dioxide is released into the atmosphere when coal burns and transforms stored sulfur into a gas. Once in the atmosphere, sulfur dioxide reacts with nitrogen oxide and water to form acid rain. Acid rain has many ecological effects, but its greatest impact is on water systems and forests.

Coal companies responded to the Clean Air Act amendments by seeking low-sulfur coal in the mountainous Central Appalachian Region of the United States. Coal companies access this coal with a method called mountaintop removal, which is a more efficient method of coal mining that uses fewer workers and accesses more coal than conventional mining. Despite these advantages, mountain top removal is highly damaging to local environments—it pollutes tap water and exposes nearby families and neighborhoods to toxic dust.

Makayla Urias holds contaminated water samples taken from her home, which is surrounded by mountaintop removal coal mining. Cathie Bird

Makayla Urias holds contaminated water samples taken from her home, which is surrounded by mountaintop removal coal mining. Cathie Bird

While the sweeping changes of the Clean Air Act improved health outcomes for many people, we cannot forget the people who have borne the costs of mountain top removal mining in Appalachia. Makayla Urias—an 8-year-old girl from Pike County, Kentucky (pictured on the right)— is one child among many living in Appalachia whose home is threatened by mountain top removal and may not have the chance to live a full life.

Researchers from the School of Public Health at Indiana University examined the relationship between mortality rates, mountaintop removal mining, and the 1990 Clean Air Act amendments in Appalachian communities in Kentucky, Tennessee, Virginia and West Virginia. Researchers surveyed the mortality rates between 1968 and 2014 using publicly available data, comparing respiratory mortality due to mountaintop removal by comparing mountain top removal counties to non-mountain top removal counties. The team also considered adult smoking rates, obesity rates, child poverty rates, and per capita supply of primary care physicians when examining mortality rates to ensure that these factors did not account for mortality rates measured in mountaintop removal communities.

Figure 1: Mortality rates from 1968 to 2014, with a divergence between counties with mountain top removal (MTR) and counties with out in years following the Clean Air Act (CAA) amendments.

Figure 1: Mortality rates from 1968 to 2014, with a divergence between counties with mountain top removal (MTR) and counties with out in years following the Clean Air Act (CAA) amendments.

The comparison revealed that mortality rates between the two groups diverged after the Clean Air Act amendments in 1990, as presented in Figure 1. This is surprising because mortality rates decreased elsewhere in the United States due to improvements in medical care. Advancements in medicine are offset in Appalachian communities by the adverse health effects of mountain top removal. The study concludes that increased mortality comes from respiratory diseases related to mountain top removal, such as bronchitis and emphysema.

The untold story of mountain top removal in Appalachian communities after the 1990 Clean Air Act amendments should serve as a cautionary tale to politicians working to address climate change. The narrow scope of the Clean Air Act amendments promoted a dangerous form of coal extraction rather than incentives to encourage development of cleaner energies. When addressing climate change, environmental policies in the United States focus primarily on limiting carbon dioxide emissions. These kinds of broad policies overlook the local exposure to poisonous toxins associated with the production and extraction of fossil fuels—as demonstrated by the communities in Appalachia.

While issues of environmental justice mostly focus on the environmental concerns that poor communities of color face, the framework of environmental justice should serve as a platform for all vulnerable and marginalized communities. Although coal-mining towns in Appalachia are largely white, both the failure of policy to protect these communities and the lack of public concern towards local air pollution demands our attention. The future lives of Makayla Urias and other children in Appalachia depend on it.

The Untold Story of Climate Change and Inuit Women

In the Canadian Arctic climate change can be added to the list of culprits melting away traditional activities just like its melting the ice caps.

The region is already challenged by high suicide rates, food insecurity and housing shortages. Climate change acts as a ‘threat multiplier’ making the people of the region increasing vulnerable to the sociocultural issues there.

Elder Josephine Ugataq smiling while showing some of the items she sews using traditional methods. photo credit: Peter Power

Elder Josephine Ugataq smiling while showing some of the items she sews using traditional methods. photo credit: Peter Power

A new groundbreaking study explores how climate change is affecting the lives of Inuit women in Iqaluit, Nunavut specifically. Most research into the gendered effects of climate change has focused on Sub-Saharan Africa and Asia, and the research on the effects of climate change on the people of the Arctic have focused on male dominated activities such as hunting, trapping and fishing. So this new study by Montreal and Ontario researchers is unique. What is the most effected aspect of the women’s lives? Key traditional activities such as berry picking and sewing.

women-on-the-porch-arctic

The environment around Iqaluit is changing rapidly.  Temperatures and moisture changes during winter impact the fruiting and flowering cycles in the region. This has resulted in the berries that used to grow abundantly around the town becoming harder to find and lower in quality. The warmer temperatures have also brought increasingly dangerous ice conditions and higher costs to hunt so the number of good quality pelts for sewing has decreased significantly.

Emotionally the changes have taken a toll.  Last year [the berry harvest] was depressing”, reported one of the women interviewed. Not being able to cultivate in their children the fond memories they have of the land or being able to harvest and eat the berries they crave makes them feel disconnected from their identity.

Sewing traditional parkas, gloves and boots promotes a strong sense of cultural pride and social connection and is even celebrated as a way of healing trauma. One middle-aged homeowner spoke of sewing as “just like meditation”.  To lose the practice is simply not an option.

So women resort to a more expensive option: purchasing skins from southern furriers or suppliers. A once relatively affordable activity that provided clothing for the family and extra income is now much more expensive. The story is similar with berry picking. Instead of carrying their children along to the local berry patch, women need to go further and further away from town to find berries. Some even turn to taking expensive boat rides across the bay to where changing temperatures haven’t effect berry harvests as dramatically. canoes-on-the-ice

In a region where 7 out of 10 preschoolers live in homes with not enough food to eat, the loss of an easy food source, and the impact of losing berry harvests is not to be underestimated.

With so many other pressures pushing against the culture and well-being of the Inuit communities in Nunavut, it seems most unfair that climate change is intensifying challenges. The study reveals just how personal climate change already is. It’s changing the landscape, habitats and climate of our great Canadian north. Will we let it take away our health, wellbeing and, rich cultures too?

The Climate Change that Gets Drowned Out

Sea turtle gliding through the water

Shivani Kuckreja

____________________________________

As soon as my feet slipped off the mossy rocks and into the cold water, I could feel the contagious energy of dozens of small sea turtles bouncing off of my legs and hips and circling around me as we all shared a spot under Hawaii’s afternoon sun. With every oncoming wave, I caught a glimpse of hundreds of shells just under the surface of the water. There were greens and greys and hints of blue; small heads and large heads bobbing under the water while the waves crashed around us. As I swam alongside the turtles, it struck me that these creatures may not be around for much longer. Almost 8,000 miles away, at Paris’ COP21 Climate Change Summit, the fate of sea turtles is being sealed.

Beginning on Monday, November 30th, over 150 world leaders and 4,000 delegates joined in Paris to discuss the solutions to global climate change and the future of our planet. “Never have the stakes been so high,” French President Francois Hollande declared.

Most associate climate change with the atmosphere and land. Few, however, truly grasp the threats that climate change poses to our oceans and their inhabitants. Since 1800, our oceans have absorbed one-third of the carbon dioxide produced by humans and one-half of fossil fuel-related carbon dioxide emissions. That is why Paris’ COP21 Climate Change Summit comes at an important point in our understanding of climate change and its implications. As climate change continues, oceanic carbon dioxide rates will continue to increase, making our oceans more acidic and less habitable for aquatic-based wildlife.

The leaders at the Summit, however, do realize that climate change affects more than just our atmosphere and our land, and they are concerned about the impacts of climate change on our oceans. On December 4th, they convened to outline and achieve four major objectives related to climate and our oceans:


  1. Highlight major climate and oceanic issues and their implications for humans and ecosystems
  2. Develop far-reaching solutions related to the problems we are facing in our oceans
  3. Share these solutions globally
  4. Collaborate to develop a five-year strategic plan to guide climate-related and ocean-related policy and action

Since the mid-1750s, oceans have become 30% more acidic. Between 1980 and 2015, our world’s oceanic carbon dioxide has risen from about 300 units of partial pressure to 400 units of partial pressure, increasing acidity by 0.10 pH units. Although a 0.10 change in acidity may seem small, this change that has occurred in just 35 years used to take up to 10,000 years to occur. In the coming years, we expect increases in oceanic acidity to occur faster than ever before.

By 2100, oceans are expected to increase in acidity by 0.30 pH units. Such a dramatic increase would drastically alter the composition of aquatic life. Coral reefs are expected to fall apart at such high acidity, leaving many ocean inhabitants, such as fish and sea turtles, without homes and sources of food. Furthermore, many creatures will not be able to breathe in such acidic waters. With more carbon dioxide in our waters, carbonate ions—those used to create the shells of clams, crabs, and lobsters, among other creatures—will decrease, leaving shelled species vulnerable to predators, and disrupting oceanic ecosystems as a result.

With these types of changes expected, oceanic ecosystems will be altered beyond repair. That is why it is important now, more than ever before, that our world leaders agree to address climate change and the suffering of aquatic inhabitants, from the coral reefs on the ocean’s floor to the sea turtles grazing the water’s surface. While each country has limited resources and unique needs, all of those present at the Summit must agree on the importance of decreasing our global dependence on fossil fuels. By forging agreements that cut back on fossil fuels, COP21 leaders can help decrease the rate of ocean acidification, and can help save the sea turtles that glide through our oceans without a voice.

The Fight to Survive: Sea Turtles in Costa Rica and Beyond

Tera with turtle

Courtesy of Tera

Courtesy of Tera

Courtesy of Tera


By Shivani Kuckreja

 COSTA RICASitting in the midst of the sprawling Las Baulas National Park, Tera Corinne Dornfeld begins to detail the many plights of sea turtles. As her turtle tattoo may suggest, Tera has devoted the past decade of her life to studying the decline of sea turtle populations. Now, from her small, dimly-lit room in the middle of Costa Rica, she shares her findings and explains why she is hopeful for the future of the species.

Just last year, it was estimated that 17%-22% of marine life caught annually by fishermen is discarded. In Costa Rica, alone, 15,000 sea turtles are killed annually by shrimpers. While the statistics seem bleak, Tera has faith that turtle excluder devices, or TEDs, can help decrease the number of turtles killed as by-catch. Rather than have fishermen unintentionally catch and suffocate sea turtles in their shrimp trawls, TEDs include areas in which sea turtles can escape the trawling nets. Citing the work of Sally Murphy, Dornfeld explains that the clunky TEDs are being remodeled to better suit thus to better appeal to the preferences of fishermen.

She also sees TEDs as an opportunity for the local Costan Rican communities to get involved. By encouraging local fishermen to join the discussion and voice their concerns and input, TEDs can be better designed for the average Costa Rican fisherman hoping to catch fish and shrimp—not turtles.

Not all sea turtle struggles can be solved by TEDs, however. It is sad to think that “after a long day of dodging fishing nets and nesting threats, leatherback turtles are still in danger when they are doing the most basic acts of all—looking for food”, Dornfeld states in despair. Drawing from her primary focus on leatherback turtles, she explains that the turtle’s only source of food is jellyfish, which is why it is so important that global communities—and, more locally, Costa Rican residents—address the littering of plastic bags, which leatherback turtles often mistake for jellyfish.

https://www.pinterest.com/pin/134334001358096177/

https://www.pinterest.com/pin/134334001358096177/

Acknowledging the impracticality and complexity of banning plastic bags, Dornfeld explains that the culture of Costa Rica is such that plastic bags are necessary, as trash and septic services in her area require all residents to dispose of trash in plastic bags. Maintaining hope, however, she sees an opportunity to ban the use of straws in restaurants around Costa Rica. Straws can get lodged in the noses of sea turtles, interfering with their breathing. After witnessing the pain inflicted on a sea turtle when a team tries to remove a straw from a turtle’s nose, Dornfeld is motivated to join forces with local Costan Rican communities to pick that battle in the coming months.

In addition to the threats that sea turtles face from plastics, Dornfeld also anticipates significant impacts on sea turtle populations as a result of climate change. The sex of sea turtles depends entirely on the temperature of the sand on which the eggs are laid. Within the next century, temperatures are expected to rise between 2.5 degrees Fahrenheit and 10 degrees Fahrenheit, and warmer temperatures yield female sea turtles. Being a tropical area, Costa Rica is especially vulnerable to the impacts of climate change. By 2050, the country’s temperatures are expected to increase by 2 degrees Celsius; by 2100, 4 degrees Celsius.

In the short-term, the number of female sea turtles are expected to rise significantly, eventually leading to a drop in overall sea turtle populations due to the absence of male sea turtles. In extreme cases of increased temperatures or decreased rain, such as what may occur in Costa Rica, many sea turtles could die.

Costa Ricans were estimated to emit only 7 million metric tons of CO2 in 2012, in comparison to the 36 gigatonnes of global emissions in 2012, but it is Costa Rican communities that will experience the severity of climate change. For the sake of under-resourced areas like Costa Rica, that have low carbon dioxide (CO2) emissions yet bear a large burden of the affects of CO2 emissions, it is imperative that countries around the world, especially developed countries, work to decrease their climate change-causing emissions, as the responsibility should not fall exclusively upon Costa Rica and similar countries.

Decreases in global CO2 emissions are imperative because Costa Rica’s economy depends heavily on tourism. Since the early 2000s, travel and ecotourism in Costa Rica has decreased, originally contributing 6.5% of Costa Rica’s GDP but declining to 4.5% of Costa Rica’s GDP by 2014. At the same time, the leatherback sea turtle population within Costa Rica has declined by over 90% since 1980, and will only further decline as climate change continues to impact our planet.

While sea turtle populations are facing incredible setbacks today, Dornfeld remains encouraged by the fact that sea turtles are an umbrella species for conservation: “When you protect sea turtles, you are protecting all other plants and animals in and around the ocean.” For starters, green sea turtles’ grazing helps maintain sea grass beds, which serve as breeding grounds for many sea creatures including fish and crustaceans. Furthermore, the unhatched sea turtles along the nesting habitat provide nutrients to dune vegetation, and stronger dune vegetation helps protect the beach from erosion.

Focusing her efforts on the powers of small-scale sea turtle conservation projects, Dornfeld looks forward to working with local communities to help ensure that sea turtles get back up on their flippers. She is also interested in learning more about how women can take time away from performing the traditional duties of a housewife to become involved in these small-scale projects. “What is possible to achieve through social science?” she asks, time and again throughout our conversation. “What needs to happen for people to drop everything and help the sea turtles?”


Dear Plastic Bag Users

Date: October 31, 2015

Subject: Floating Plastics and Dying Turtles

Recipients: Concerned Coastal Citizens

http://radicalmycology.com/2012/07/03/fungi-the-plastics-problem/

http://radicalmycology.com/2012/07/03/fungi-the-plastics-problem/

http://ecotoad.org/category/ocean/

http://ecotoad.org/category/ocean/

Dear Plastic Bag Users,

With the number of plastic bags found in the ocean, you could travel to the moon over one thousand times. 10% of plastics produced end up in the ocean; over 13 million tons of plastic are dumped into our waters annually. As a consequence, 1 in every 2 sea turtles has eaten plastic. Some, like leatherback turtles, mistake plastic for jellyfish, their primary food source. Consuming plastics can block the intestines of sea turtles and eventually lead to death. In addition to ingesting plastic, turtles often become deformed after getting caught in plastic can holders and bottles, and can suffocate from being trapped in plastic debris. Only one in one thousand sea turtles survive to adulthood today, in a large part due to plastic debris in our oceans.

Thankfully, you can help! By decreasing your use of plastics and working to reduce the amount of plastic entering our waters, you can save hundreds of thousands of sea turtles. Beginning with the most practical acts and progressing to more complex ones, below are some ways in which you can help:

  • Coastal cleanups and proper disposal

Be sure to dispose of your trash appropriately. That small cup that you leave on the beach will break down in the water, making it easily digestible for sea turtles and other sea creatures. That plastic bag that you were using to throw away your cherry stems will look exactly like a jellyfish to a hungry leatherback turtle, who will realize the difference when it is too late. Those plastic can holders will envelope a baby sea turtle, growing with it and deforming it as time progresses. Trash from sewage drains is also emptied into our oceans and contributes to the creation of man-made garbage patches, which you can read more about here. America is one of the top 20 sources of plastic marine debris. Let’s change this.

http://www.mnn.com/earth-matters/wilderness-resources/blogs/sea-trash-spiraling-out-of-control-study-finds

http://www.mnn.com/earth-matters/wilderness-resources/blogs/sea-trash-spiraling-out-of-control-study-finds

  • Opt for reusable bags and containers rather than plastic bags.

Instead of double-bagging your milk and orange juice, bring your own reusable bag to the supermarket. According to the Natural Resources Defense Council, the average American family uses 1,500 plastic bags a year. Think about all of the Ziploc bags you use for packing lunches, and all of the plastic bags you use as storage during transport, and as trash bags. Everything adds up. Do your part in helping keep our oceans clean and our sea turtles safe by opting for reusable bags rather than plastic bags. As an added bonus, reusable bags are also sturdier and more durable, and many contain insulation to keep foods hot or cold. To learn more about why switching out plastic bags for reusable bags is a good idea, check out this Huffington Post article.

http://www.notcot.com/tag/reusable+bag

http://www.notcot.com/tag/reusable+bag

http://www.amazon.com/EasyLunchboxes-3-Compartment-Bento-Containers-Classic/dp/B004S129AQ

http://www.amazon.com/EasyLunchboxes-3-Compartment-Bento-Containers-Classic/dp/B004S129AQ

  •  Support local banning or taxing of plastic bags. 

In many states, plastic bags are taxed or banned. The Hawaiian islands of Kaua’i and Maui have banned all non-compostable plastic bags. Vermont is currently looking to ban plastic bags and its petition needs less than 200 signatures to gather the support of 1,000 people. Similarly, New York City also has a petition in place to ban the use of plastic bags in stores throughout the city. I encourage you to learn more about your state’s efforts to reduce the number of plastic bags its residents use. You may come across a petition you did not know was being circulated. If there are no petitions or proposals in place, write your own!

  • Donate to causes that are helping keep plastics out of waters for sea turtles

Donating to The Sea Turtle Conversancy and See Turtles, among other programs, is a great way to contribute to the wellbeing of sea turtle populations. Even a $5 donation can go a long way towards ensuring that sea turtles prosper in the future. 

http://news.nationalgeographic.com/news/2014/04/140414-ocean-garbage-patch-plastic-pacific-debris/

http://news.nationalgeographic.com/news/2014/04/140414-ocean-garbage-patch-plastic-pacific-debris/

  • Spread the word!

 It is so easy to ignore what happens to plastic bags once they are out of your hands. Please let people around you know that each bag lives a long life, often in oceans surrounding hungry sea turtles and other marine mammals. You can make a difference and, together, we can create long-term change.

Progressing from simple actions to more challenging ones, these actions illustrate a number of ways in which you can make a difference in the lives of sea turtles. Without change, the amount of plastic in our oceans may double within the next ten years. Play a role in helping keep our oceans clean. Take a moment to consider those that live out of sight. There is a world underwater that we feel quite distant from, but, with your help, we can bridge the gap between our differences and create a home for everyone on the one planet that we all share.

Sincerely,

Shivani Kuckreja, a fellow concerned coastal citizen


http://www.seaturtlecamp.com/costarica/

http://www.seaturtlecamp.com/costarica/